20 Nov 2023
7 Min Read
Analyzing Real-Time NYC Bus Data with DeltaStream
Most of us who have lived in a big city have had some experience taking public transportation. While it’s extremely satisfying when everything works out, I know I’m not alone in my frustrations when subway time estimates aren’t accurate or buses just never show up. Standing there and waiting for a bus or train can be very stressful as you begin to wonder if the train has already left, if this is going to impact your transfer to another bus, or if you’ll make it to your destination on time (especially stressful if you’re trying to catch a plane). One way that Google is playing a part in improving some of these challenges is with the General Transit Feed Specification (GTFS) and its real-time counterpart, GTFS Realtime. GTFS helps bring standardization to transit feeds by providing a framework for transportation companies to submit feeds and for developers to write applications to process these feeds.
In this blog post, we’ll be showcasing how you can use DeltaStream to process New York City’s real-time bus feed, which adopts the GTFS realtime specification, to identify buses that are becoming increasingly delayed in real time.
Setting up DeltaStream
To set up our use case, first we need to load the bus data into Kafka:
- Sign up for an MTA BusTime Developer Key
- Have Kafka or a Kafka-compatible integration such as a Confluent or RedPanda cluster available, Confluent Cloud and RedPanda both offer free trials of their product
- Clone this github repository then follow the instructions to build and run a Java program which will poll the bus feed and forward the events into your Kafka cluster
DeltaStream for real-time processing
Now that we have our bus feed data in Kafka, we can use DeltaStream to process the data. If you are new to DeltaStream and don’t have an account, you can sign up for a free trial here.
Connect to and inspect source data
First, add your Kafka cluster as a Store in DeltaStream. Adding the Store defines the connectivity between DeltaStream and your storage layer, in this case a Kafka cluster. You can choose any name you want for your Store, but for this use case let’s assume the Store is called “kafka_store”. From here, we can inspect the topics by printing them. The two topics we’ll be using for our example are the “nyc_bus_trip_updates” and “nyc_bus_vehicle_positions” topics.
Print the nyc_bus_trip_updates topic:
Print the nyc_bus_vehicle_positions topic:
We can define Streams for nyc_bus_trip_updates and for nyc_bus_vehicle_positions with the following queries.
DDL to create nyc_bus_trip_updates Stream:
DDL to create nyc_bus_vehicle_positions Stream:
Notice that both feeds have a field called trip which represents a particular trip a bus is taking. We’ll be using this field to join these Streams later on.
Also, since the timestamp field is given as epoch seconds, let’s make our data easier to read by defining new Streams that convert these fields to timestamps. We can do this with the following CREATE STREAM AS SELECT (CSAS) queries:
CSAS to create trip_updates:
CSAS to create vehicle_positions:
Detecting transportation delays
You may have noticed in the nyc_bus_trip_updates topic that there is a field called delay. This field represents the number of seconds that a bus is currently delayed from its original route. Reporting this data is really helpful, as it provides transparency to transit-goers on how late they’re going to be or how long they may need to wait for the bus. However, what’s not always clear is if delays are increasing. For our use case, this is exactly what we want to detect. Once we detect which bus trips are becoming increasingly delayed, we also want to provide additional information about where the bus is and where the bus has recently been so that city officials and bus planners can see where delays may be occurring.
Processing real-time bus data
For our use case, we’ll be splitting up the processing into two queries.
In the first query, we will analyze the trip_updates Stream to find trips where delays are significantly increasing. We consider three consecutive trip updates that each grow in delay by 30 seconds to be significant, so we can write a pattern recognition query to detect trips that match our requirements. Those trips will then be written to a Stream to be used as the input for our second query.
Query 1:
Pattern recognition query to find bus trips that are increasing in delay
In the second query, we will join the output of our first query with the vehicle_positions Stream on the trip field. When joining two Streams, we need to specify a WITHIN interval as part of the join condition (these kinds of joins are called Interval Joins). For our query, we’ll specify the timestamp field to be avg_ts, the middle point in our increasing delay interval that we identified from the first query. We’ll also use 3 minutes for our WITHIN interval, meaning positions for a trip with a timestamp 3 minutes before and 3 minutes after avg_ts will satisfy the join condition. The resulting records of this query will represent the positions of buses that are part of delayed trips.
Query 2:
Interval join query to join the bus trips that are growing in delay with bus locations
By submitting these queries, DeltaStream has launched long-lived jobs that will continually read from their sources, transform the data, then write to their sinks. So, as bus data arrives in our Kafka topics, we can expect data processing to happen immediately and the results to arrive nearly instantaneously.
Inspecting real-time results
Let’s inspect the contents of these Streams to see how our queries behaved.
Data in our source trip_updates Stream:
Data in our source vehicle_positions Stream:
The results of Query 1 in our trips_delay_increasing Stream:
The results of Query 2 in our delayed_trip_positions Stream:
In the results above, we can see the trip with a tripId of CS_D3-Weekday-SDon-124200_Q28_655 with increasing delays in a short period of time. Our first query identifies that this trip’s delay is growing, and outputs a record for this trip. Our second query ingests that record and finds the vehicle positions at the time of the delay.
By plotting the positions seen in our results for delayed_trip_positions above, we get the following map:
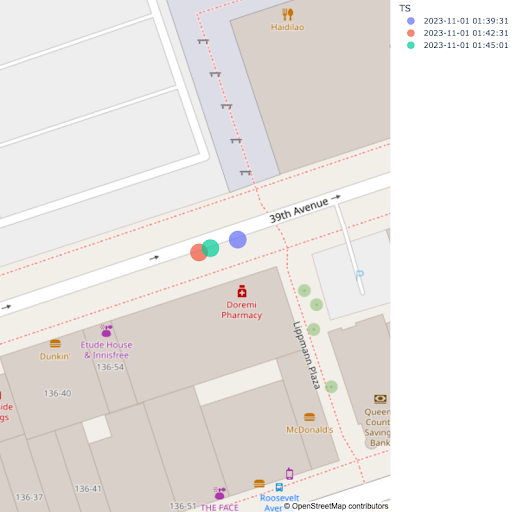
There must be some traffic on 39th Avenue!
In this example, we’ve highlighted two ways real-time processing can help provide a better experience to public transit users:
- Having real-time data about growing delays can help provide more accurate time estimates on bus arrival times
- Insights into locations where bus delays grow can help city planners better understand and improve traffic patterns in their cities
Conclusion
The GTFS real-time data feeds are great for building real-time transit applications. However, for any real-time computations that are complex or require stateful operations, it can be difficult. In this blog post, we showcased how you can easily build stateful real-time jobs on top of this data feed in minutes using DeltaStream. Further, as a fully managed serverless product, DeltaStream handles all of the operational overhead of running long-lived stream processing jobs.
If you want to learn more about DeltaStream or try it for yourself, you can request a demo or join our free trial.