05 Aug 2025
Min Read
Building a Real-Time Generative AI Pipeline for Sepsis Detection with DeltaStream
Table of contents
- The Use Case: Early Sepsis Detection
- The End-to-End Architecture
- Part 1: Simulating the Real World (Java/Python & Kafka)
- Part 2: The Real-Time Brain (DeltaStream)
- Step 1: Create a Stream on the Kafka Topic
- Step 2: Calculate Clinical Features
- Step 3: Construct the LLM Prompt
- Step 4: Call the LLM and Store the Response
- Part 3: Closing the Loop - Taking Action
In modern hospitals, nurses and doctors are inundated with data from countless monitors and systems. Yet, one of the most dangerous conditions, sepsis, often develops from subtle, overlapping changes in a patient's vital signs that can be easily missed during routine, periodic checks. The challenge isn't a lack of data, but a lack of real-time, contextual insight. What if we could build a system that continuously watches for these developing patterns, acting as a vigilant digital guardian for every patient?
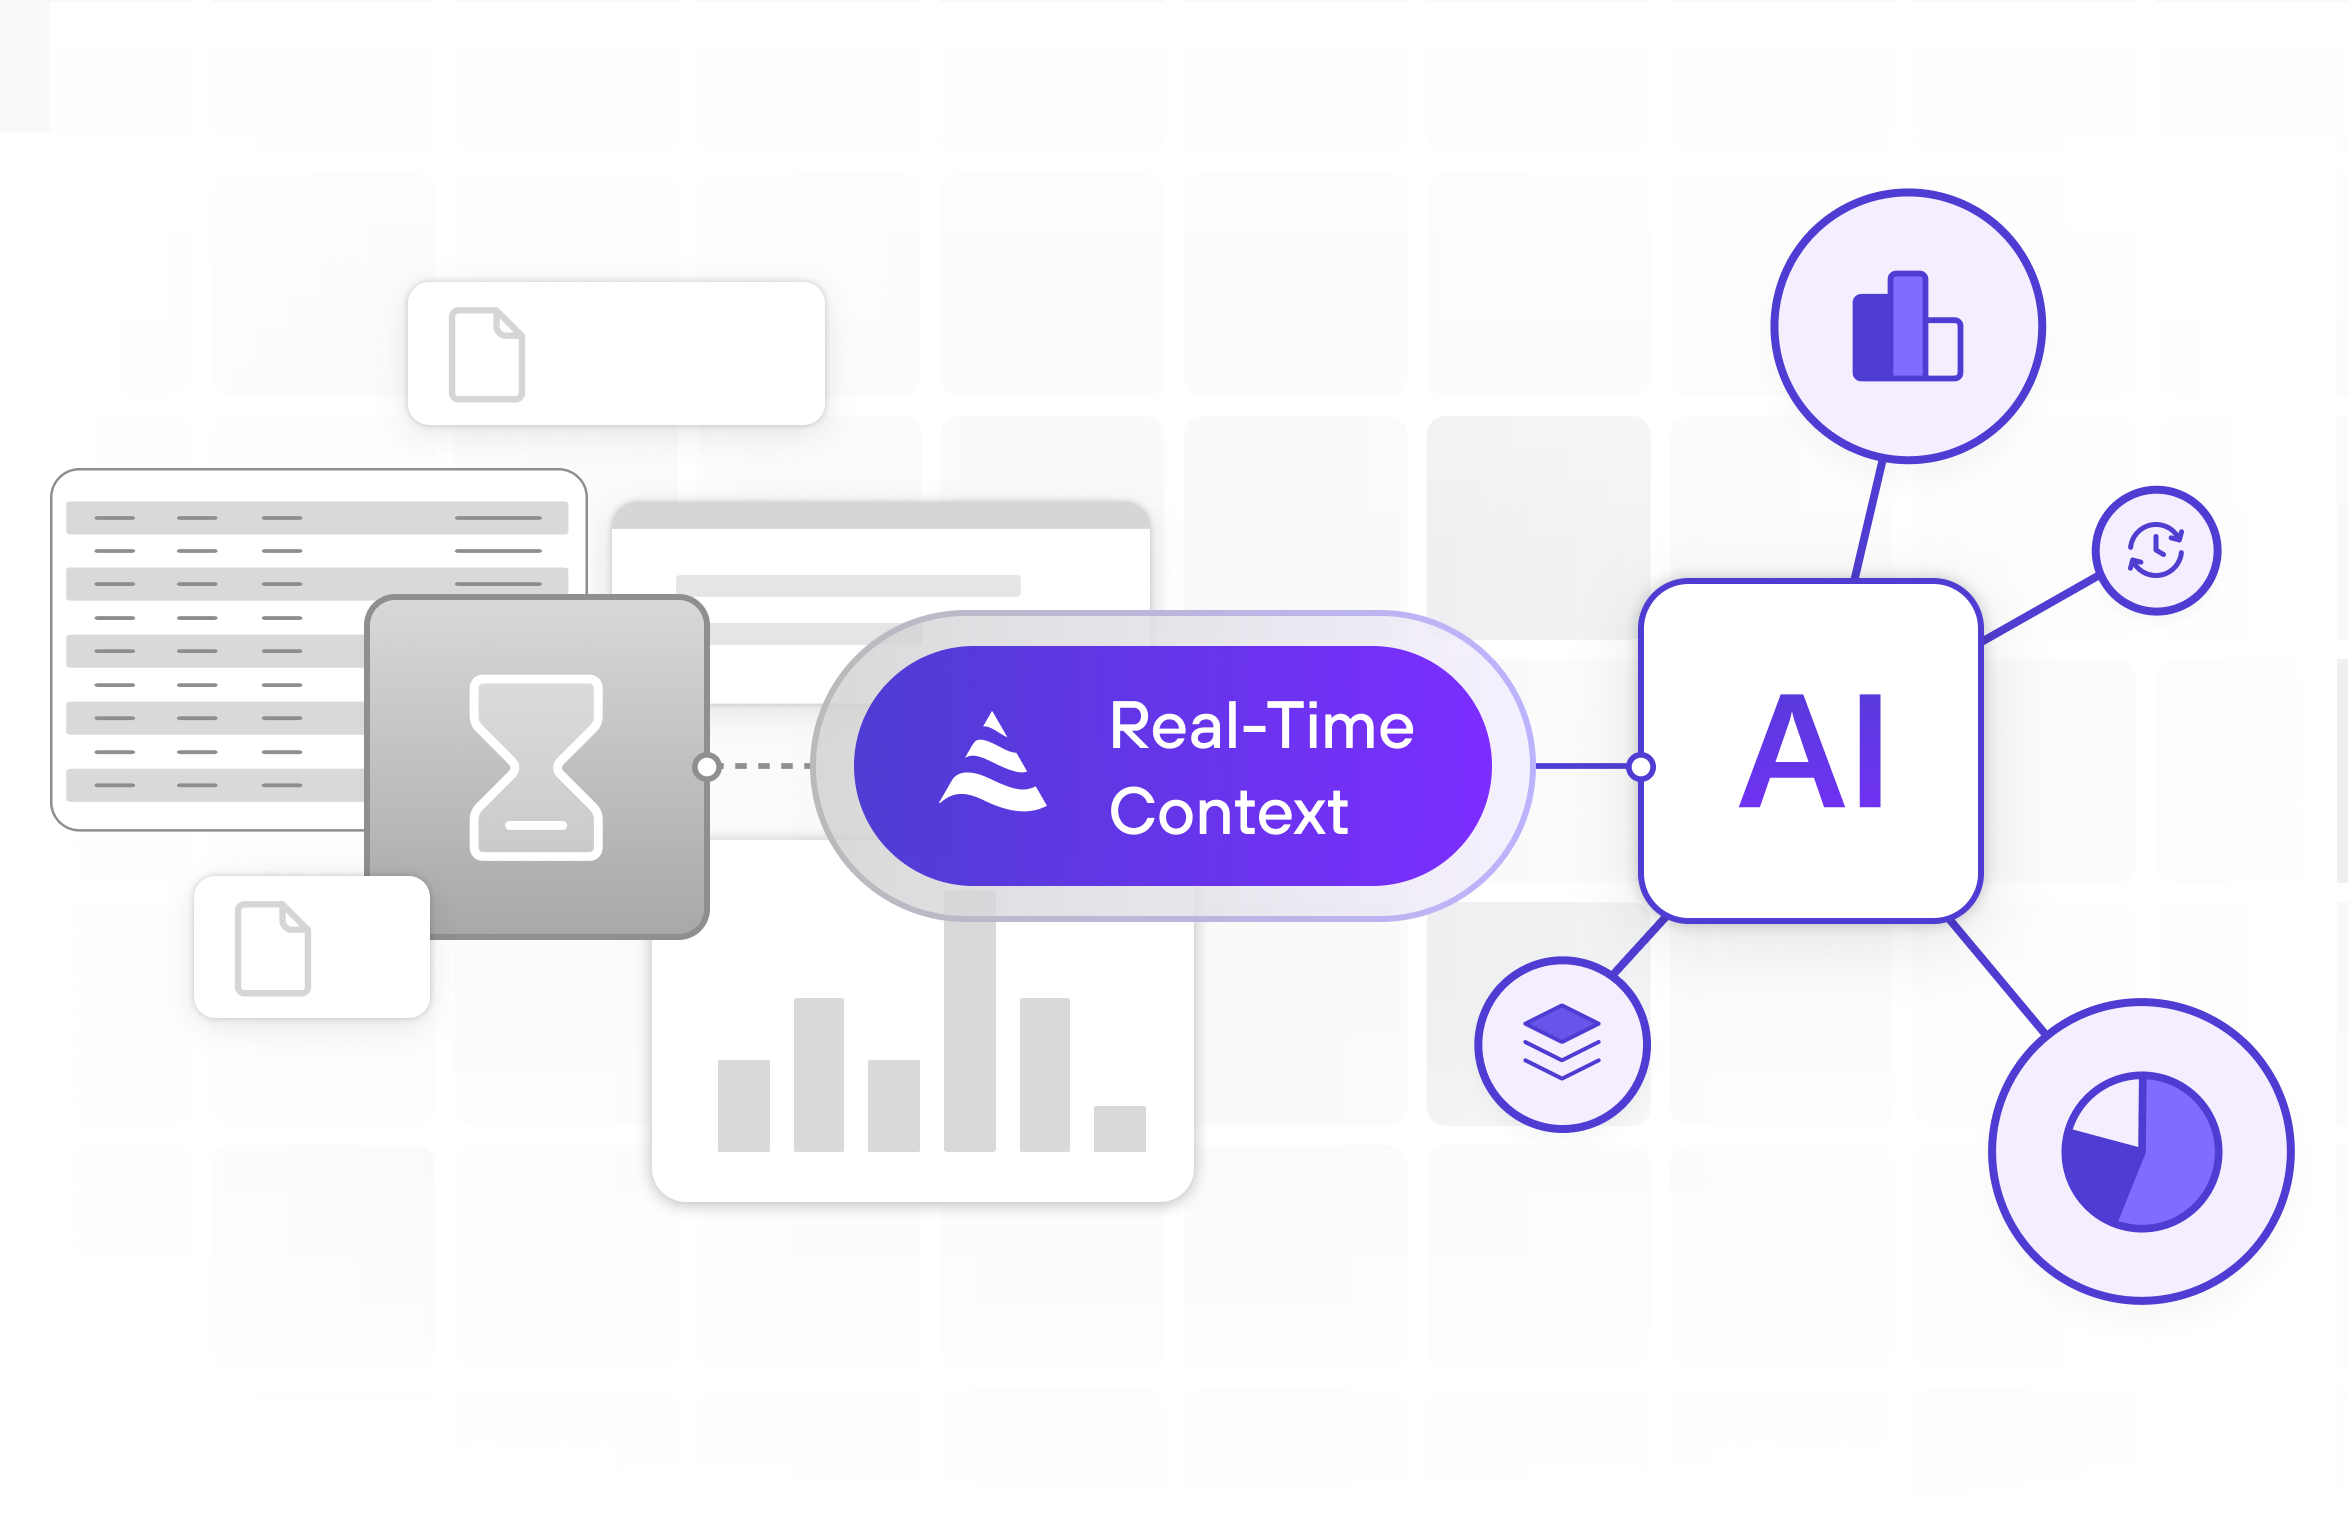
This is now possible. Using medical-grade wearable sensors, we can capture a continuous, high-fidelity stream of patient data. But raw data alone is not enough; a stream of heart rate numbers without context is just noise. To be effective, we need a way to process this data in real-time, understand its trajectory, and infer a patient's condition as it evolves.
In this post, we will design a complete, end-to-end inference pipeline for the early detection of sepsis in post-surgical patients. We'll show how to use Kafka to stream the data and DeltaStream to process it, call a Generative AI model for clinical inference, and serve the results—all within a single, powerful real-time platform.
The Use Case: Early Sepsis Detection
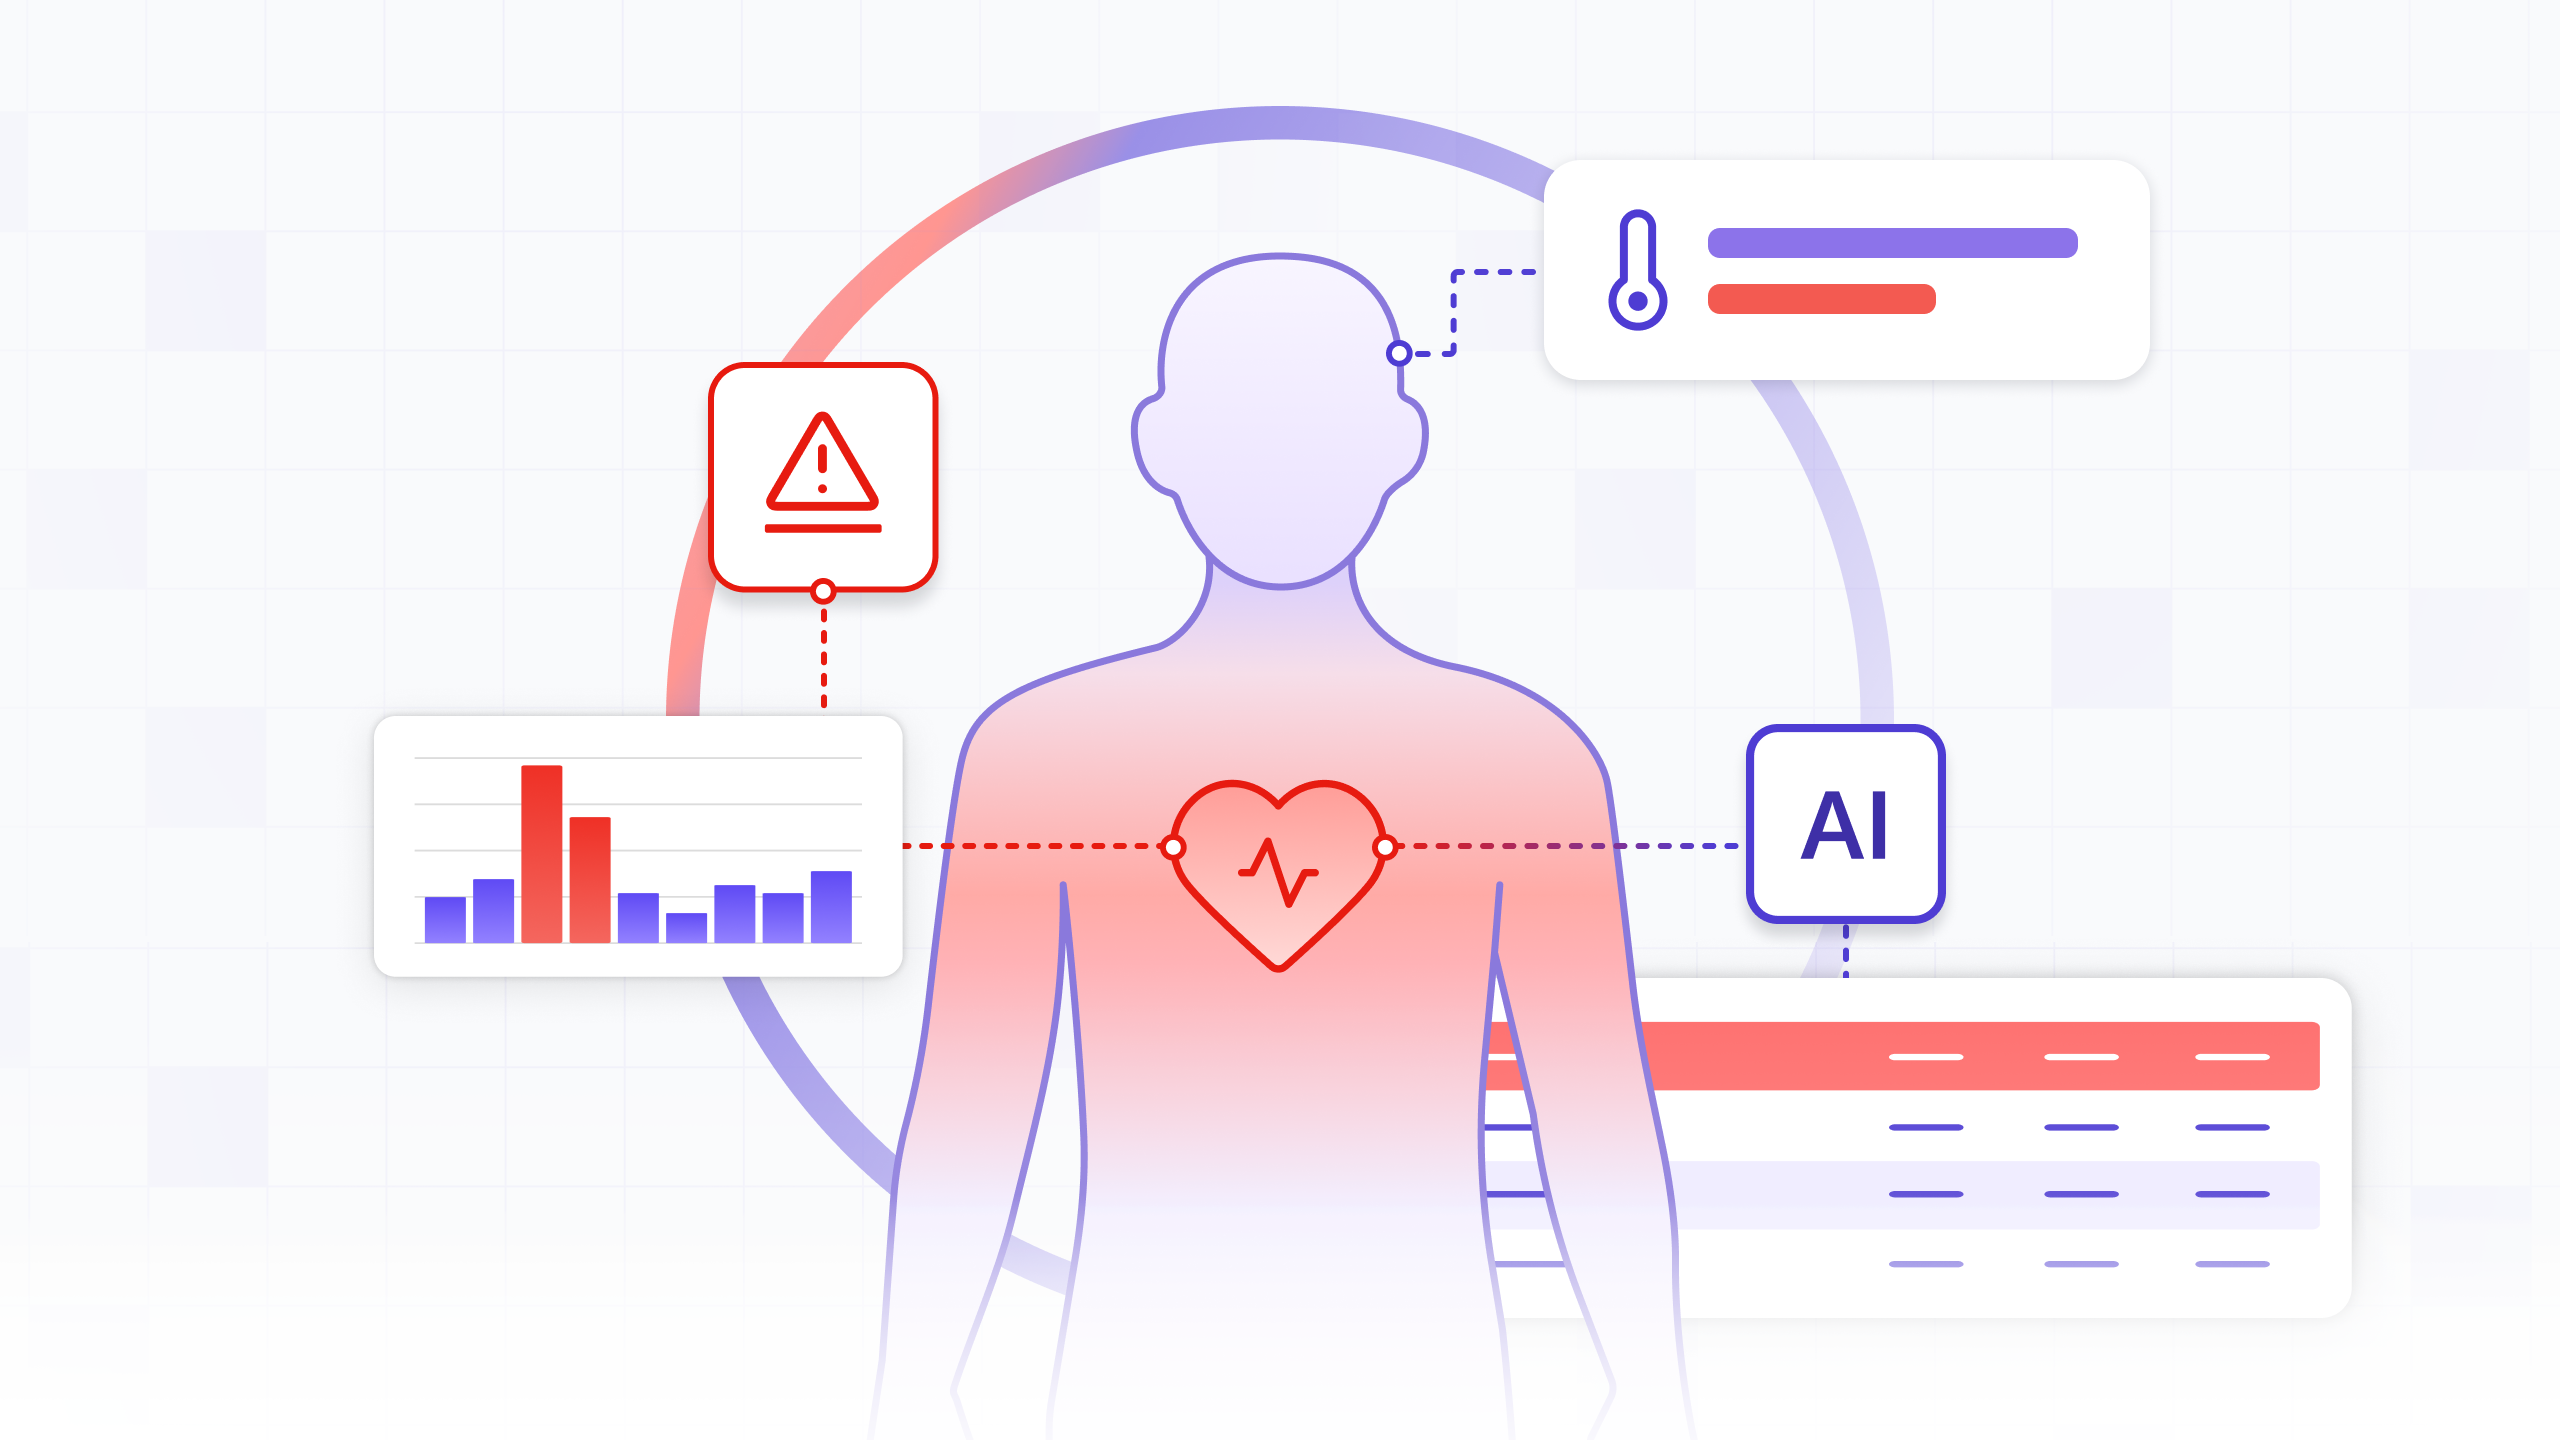
Sepsis is a life-threatening condition where the body's response to an infection damages its own tissues. The early signs are often a combination of factors—such as an elevated heart rate, high respiratory rate, and abnormal temperature—that, in isolation, might not seem alarming. A wearable vitals sensor continuously tracks the key vitals relevant to sepsis detection:
- Heart Rate (HR) at rest
- Respiratory Rate (RR) at rest
- Skin Temperature
- Activity Level
Our goal is to build a system that analyzes the continuous stream of these vitals to flag patients at high risk of developing sepsis before a full-blown crisis occurs. This automated approach helps clinicians spot danger earlier by continuously evaluating criteria similar to clinical standards like the qSOFA (Quick Sequential Organ Failure Assessment) score.
The End-to-End Architecture
Our inference pipeline will consist of four stages, creating a highly efficient, low-latency flow from data generation to an actionable alert, with DeltaStream at the center.
- Data Generation (Sensor -> Kafka): A simulator acts as the sensor's gateway, sending a constant stream of patient vital signs into a Kafka topic. This represents the raw data feed from the hospital floor.
- Real-Time Feature Engineering (DeltaStream): DeltaStream ingests the raw vitals from Kafka. It uses continuously running SQL queries to transform the noisy, high-volume stream into clinically relevant features and trends, such as moving averages and standard deviations.
- In-Stream Inference (DeltaStream UDF): A User-Defined Function (UDF) within DeltaStream calls a healthcare-focused LLM API directly. This passes the real-time features to the AI to get a clinical assessment as the data is being processed, eliminating the need for a separate microservice.
- Alerting Sink: The final results, including the LLM's risk score and justification, are written from DeltaStream to a downstream sink (e.g., another Kafka topic, a webhook, or a monitoring dashboard) for immediate action by clinical staff.
Part 1: Simulating the Real World (Java/Python & Kafka)
First, our system needs data. We'll create a synthetic data generator that mimics a fleet of wearable sensors sending data for multiple patients. Using realistic, synthetic data is a critical first step for safely developing and validating the pipeline's logic before it's used in a clinical setting. Each message is a JSON object representing a single reading. You can find the runnable data generator code at https://github.com/deltastreaminc/examples/sepsis_detection.
Kafka Topic: bio_vitals
Sample JSON Message:
A simple script would continuously generate these messages with slight variations and push them into the bio_vitals Kafka topic. For at-risk patients, the script would simulate gradually worsening vital signs.
Part 2: The Real-Time Brain (DeltaStream)
This is where we turn raw data into a final, actionable verdict. We'll use DeltaStream's powerful SQL interface to process the bio_vitals stream and call our LLM. This is done by building a chain of CHANGELOG streams, where each step refines the data, making the pipeline modular and easy to debug.
Log into your DeltaStream workspace and run the following DDL.
Step 1: Create a Stream on the Kafka Topic
First, we tell DeltaStream about our Kafka source. This CREATE STREAM statement creates a live, queryable "window" into the data flowing through Kafka.
Step 2: Calculate Clinical Features
Next, we create our first CHANGELOG stream. It consumes the raw vitals and calculates key clinical features over a 15-minute tumbling window.
Step 3: Construct the LLM Prompt
Using the features from the previous step, we create another CHANGELOG stream to construct the precise text prompt that will be sent to the Gemini LLM.
Step 4: Call the LLM and Store the Response
Now, we call your pre-defined call_gemini_explainer(prompt) UDF and store its raw JSON response in our final CHANGELOG stream.
Part 3: Closing the Loop - Taking Action
The patient_sepsis_alerts changelog now contains the final output of our pipeline. We can query this stream and parse the JSON response on the fly to drive our alerting systems.
This final query can be configured to sink its results directly to an alerting system:
- Push to Kafka: Send high-risk alerts to a dedicated
sepsis_alertsKafka topic for integration with a hospital's Electronic Health Record (EHR) systems. - Webhook: Trigger a webhook to send a real-time message to a clinical communication platform like Slack or Microsoft Teams.
- Dashboard: Serve as the direct source for a real-time monitoring dashboard for charge nurses and physicians.
By embedding the LLM call within DeltaStream, we have built a highly efficient, scalable, and elegant real-time inference pipeline. We've eliminated intermediate services, reduced latency, and simplified the overall architecture, creating a powerful system that bridges the gap between raw sensor data and life-saving clinical action.
The runnable DeltaStream SQL code for this use case is available at https://github.com/deltastreaminc/examples/sepsis_detection.
This blog was written by the author with assistance from AI to help with outlining, drafting, or editing.